We have over 25 years of experience using standard and custom-developed GIS and
image processing software to render, analyze, and animate 3-dimensional surfaces
and spaces. These techniques let you see, interact with, and understand your data
on an intuitive basis, using your innate expertise developed through a lifetime of
navigating and comprehending the real 3-dimensional world of surfaces, shadows,
and spatial relationships. Not to mention that they just look cool...
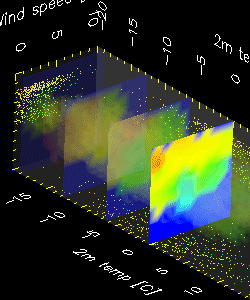
Animation: Data AnimationNon-geographic data can be animated to facilitate visualization and understanding of multi-dimensional data structure. This animation looks at the concentration of NO2 due to car emissions (colored data cloud) as a function of 3 variables: number of cars per hour, air temperature 2 meters above the ground, and wind speed. The animation provides a more comprehensive look at the multivariate structure than can be easily gleaned from scatterplots and regression coefficients. (Data from StatLib, contributed by Magne Aldrin). |

