Our staff has a particular depth in the application of GIS and visualization
technologies to the geosciences, from technical modeling and analysis of
sub-surface structure and groundwater to global climate analysis. We have
the knowledge, experience, and familiarity to help you with a wide range of
environmental, geotechnical, and climate-related problems.
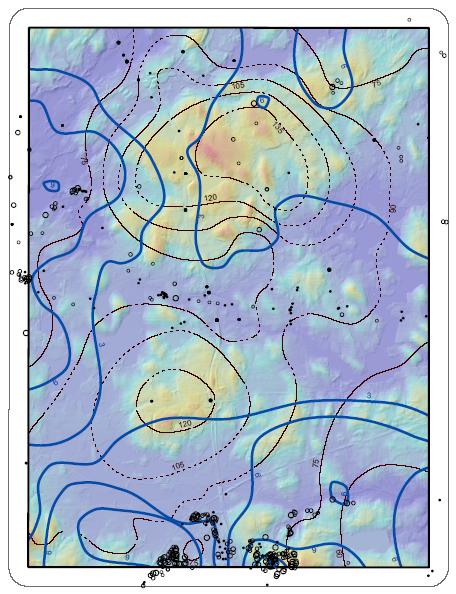
Geoscience: Well Analysis
Click to see larger in another window
Click to see larger in another window
These maps show some results of a pilot study in Massachusetts in which well data from 8 different sources were compiled, standardized, quality-checked, and analysed to predict the bedrock surface, the groundwater surface, and the well yield variations across a single USGS quad. The first map identifies the location and source of all the wells; the second map shows those wells with water level information, as well as predicted contours of depth to water and water surface elevation. The shaded-relief base map in both cases shows the surface topography. |