The earth's surface is the most fundamental element in virtually all GIS
applications, because it influences or determines most geographic phenomena,
from river networks to road networks, retail sites to recreation sites,
hazardous areas to havens. We have decades of experience mapping, modeling,
analyzing, and visualizing terrain from local to global scales. We
have developed expertise and custom tools for solving a wide range of applied
challenges involving the earth's surface.
Terrain: Surfaces & Swaths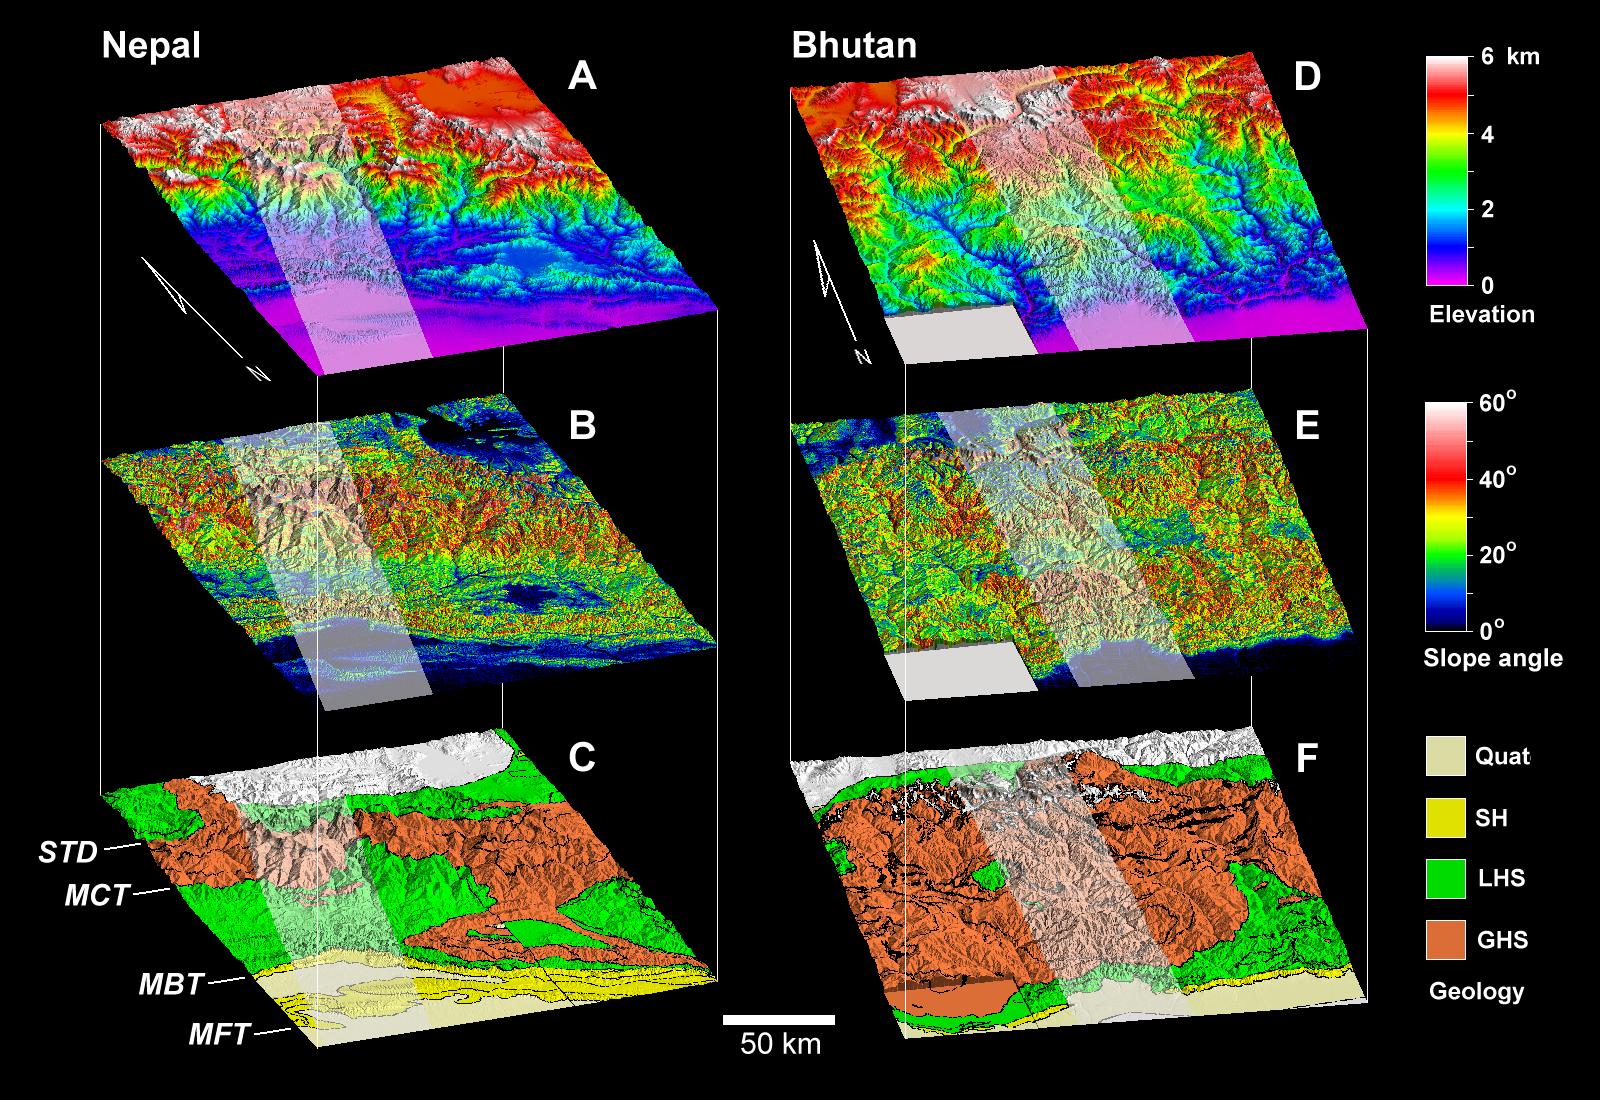
Click to see larger in another window
Click to see larger in another window
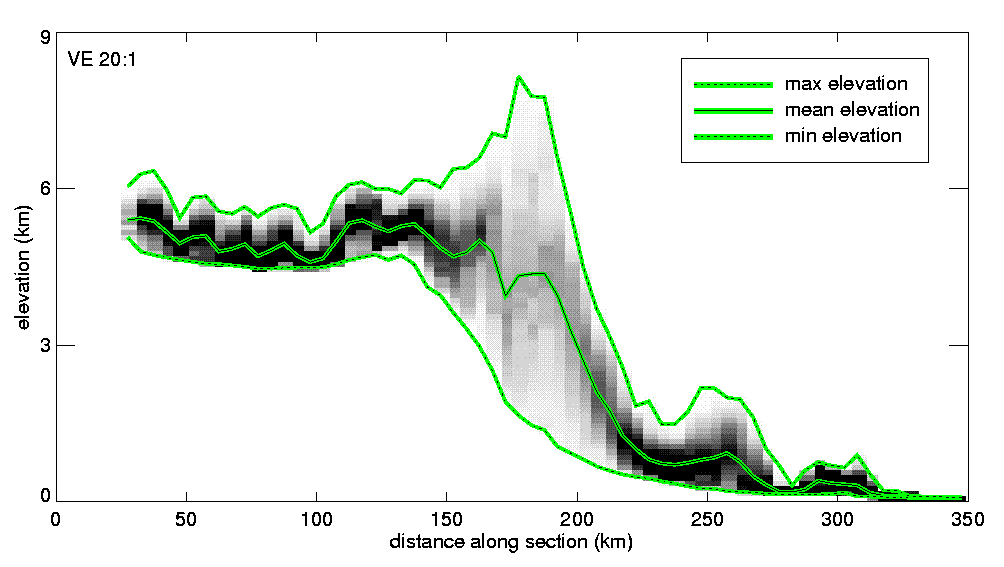
We use our own custom software to generate swath profiles of surface values such as elevation (below). The path of the swath is shown in as a lighter-colored band crossing the surfaces above. All values within the swath are projected onto the vertical plane running down the center of the swath, giving a much more informative type of cross section than a simple transect, which may miss important features that are just off the transect line. Our swath profiles give maximum, mean, and minimum values along the section within the swath, as well as density (frequency) plots of the values (greyscale checkerboard in the background). Input data can be points or rasters, and swaths can be single or multiple polylines. |