GIS and data visualization tools have transformed our ability to
understand complex geographic (and non-locational) relationships by
catering the representation of the information to our innate
human expertise in comprehending two- and three-dimensional
spaces. Many problems can be quickly assessed - at least in
a preliminary way - through the use of well-designed graphics
that reveal the key spatial relationships between two or more
things.
Visualization: Data Visualization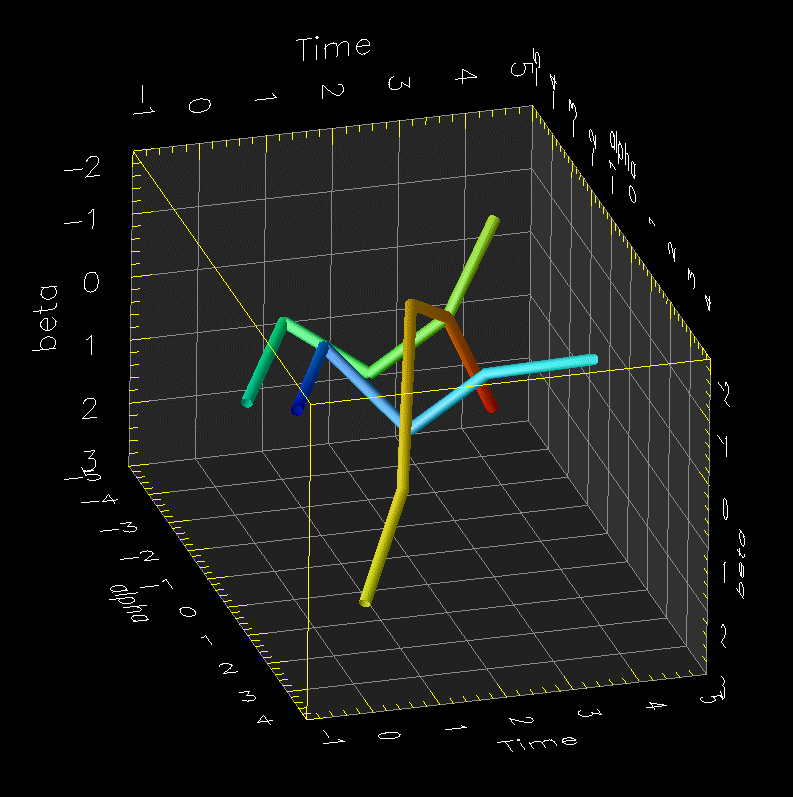
Click to see larger in another window
|